
Immersive virtual reality
for vector geometry
Leveraging virtual reality to enhance undergraduate learning in vector geometry and data analytics: a multi-disciplinary exploration.
Two dimensions cannot hold a projection
Traditional 2D pedagogies fail to address students' difficulty visualising complex algebra and vector geometry, especially vector projections and multidimensional spatial transformations. We fill this gap by leveraging VR to provide an interactive, spatial learning environment, offering multidisciplinary empirical insights into its cognitive and pedagogical impacts, and establishing a scalable framework for higher education.
The module targets ETW2510 Introduction to Econometrics, ETW3483 Applied Analytics, ETW1001 Introduction to Statistical Analysis, ETW3510 Applied Econometrics, ENG1090 Foundation Mathematics and ENG2005 Advanced Engineering Mathematics.
- How does virtual reality improve students' understanding of vector algebra and geometry, including the equations of lines and planes?
- What are students' perceptions of using VR as a tool for learning vector algebra and geometry?
- Does VR reduce the difficulty students face when learning abstract concepts in vector algebra and geometry?
- How does the use of VR influence students' willingness to adopt immersive technologies for future learning?
From headset to browser
The module piloted here has since been rebuilt as Vector Studio, a browser application needing no headset, no installation and no sign-in. The VR and AR builds remain available.
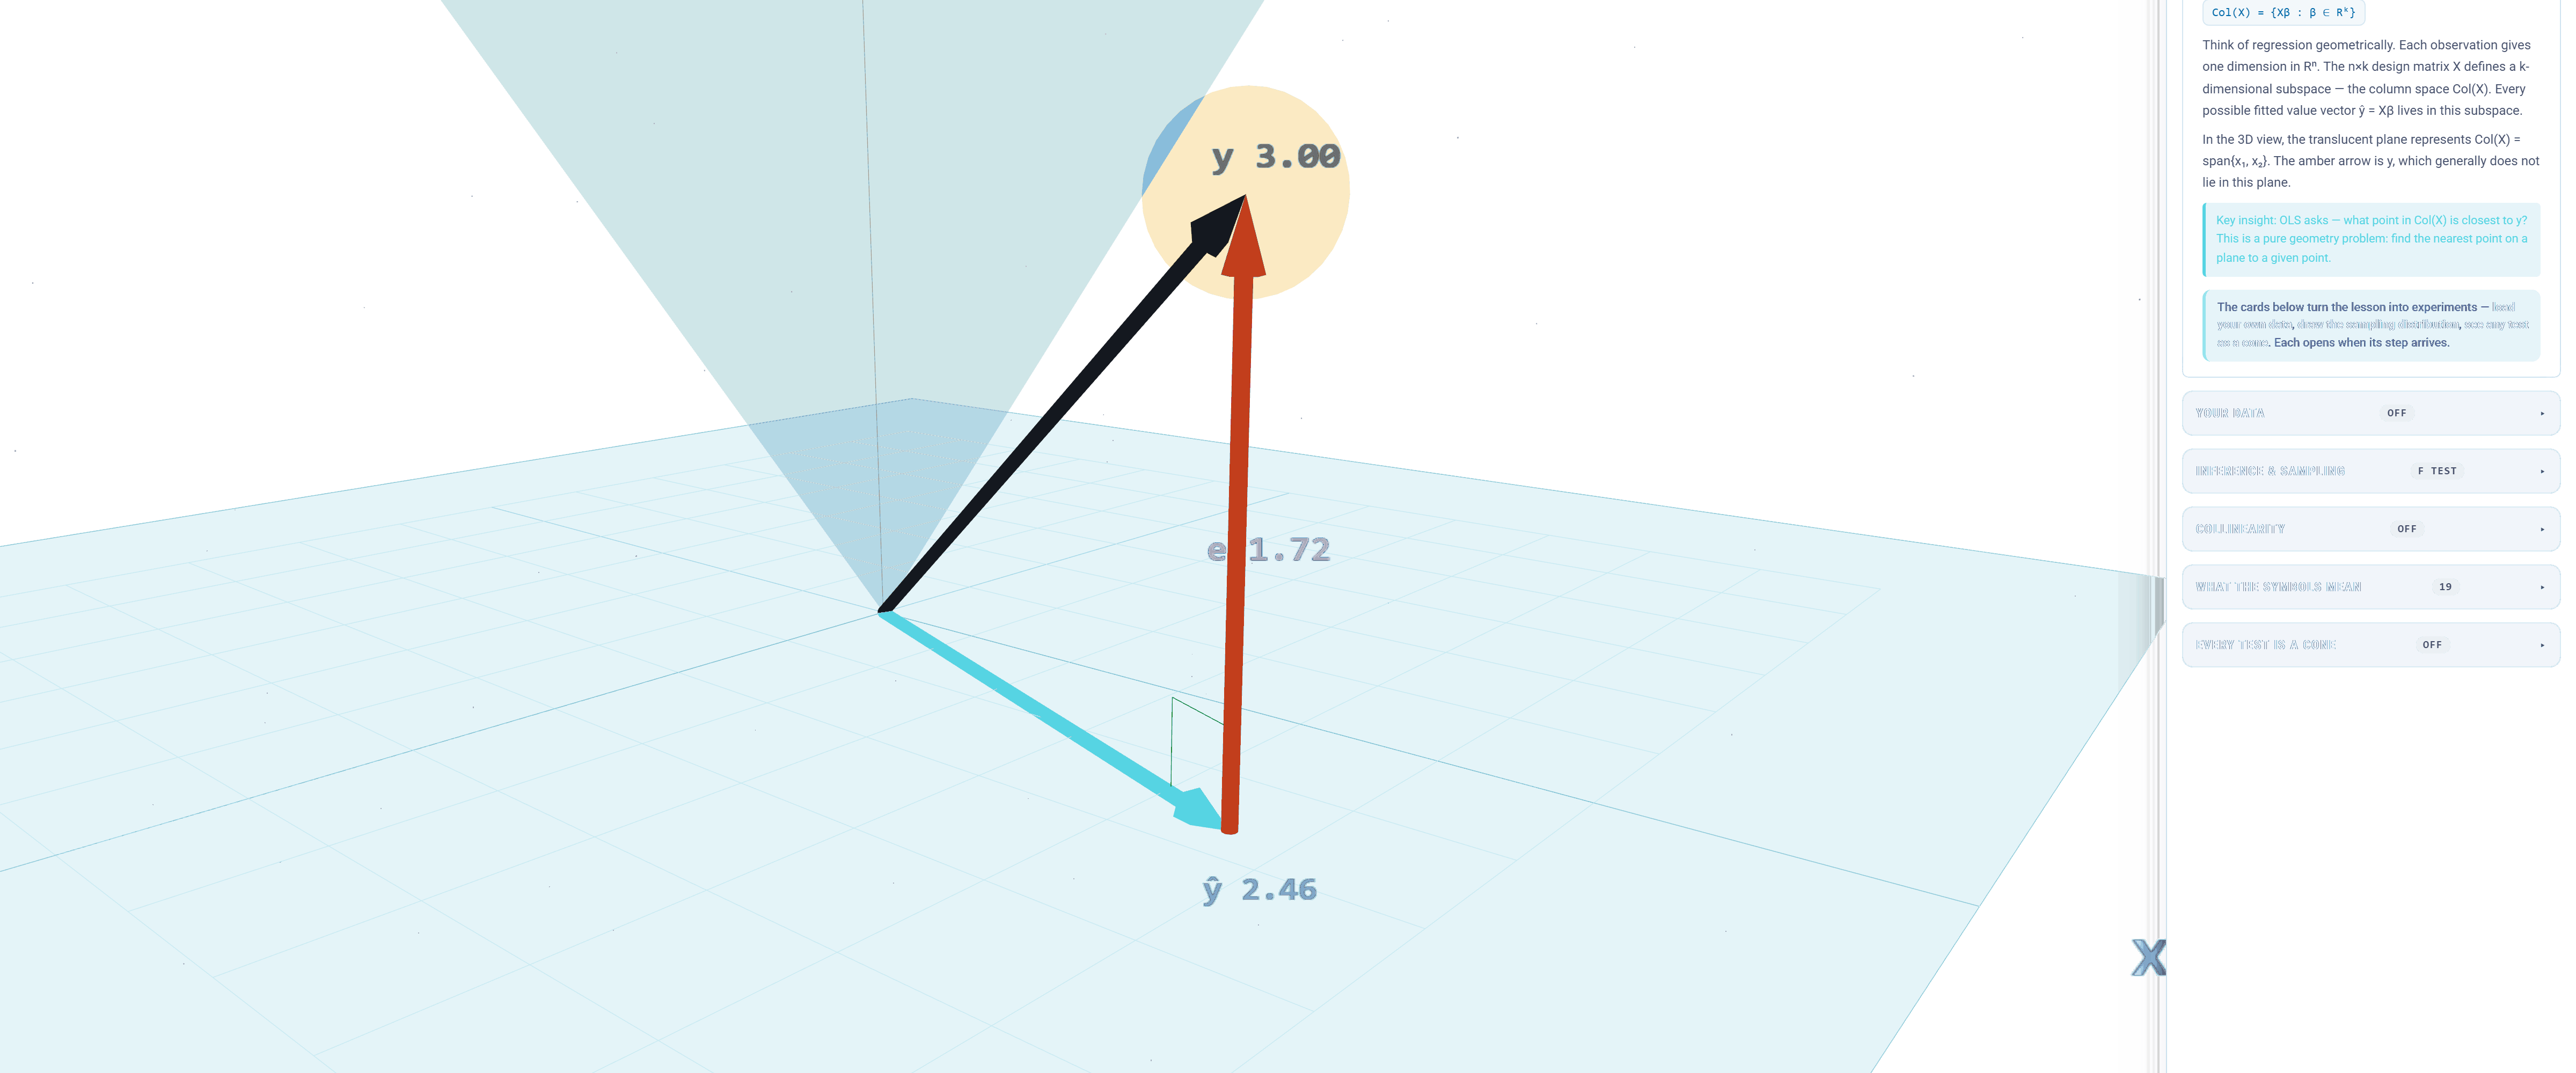
The test as an angleThe acceptance region of the F test, drawn to scale about the normal to the column space.
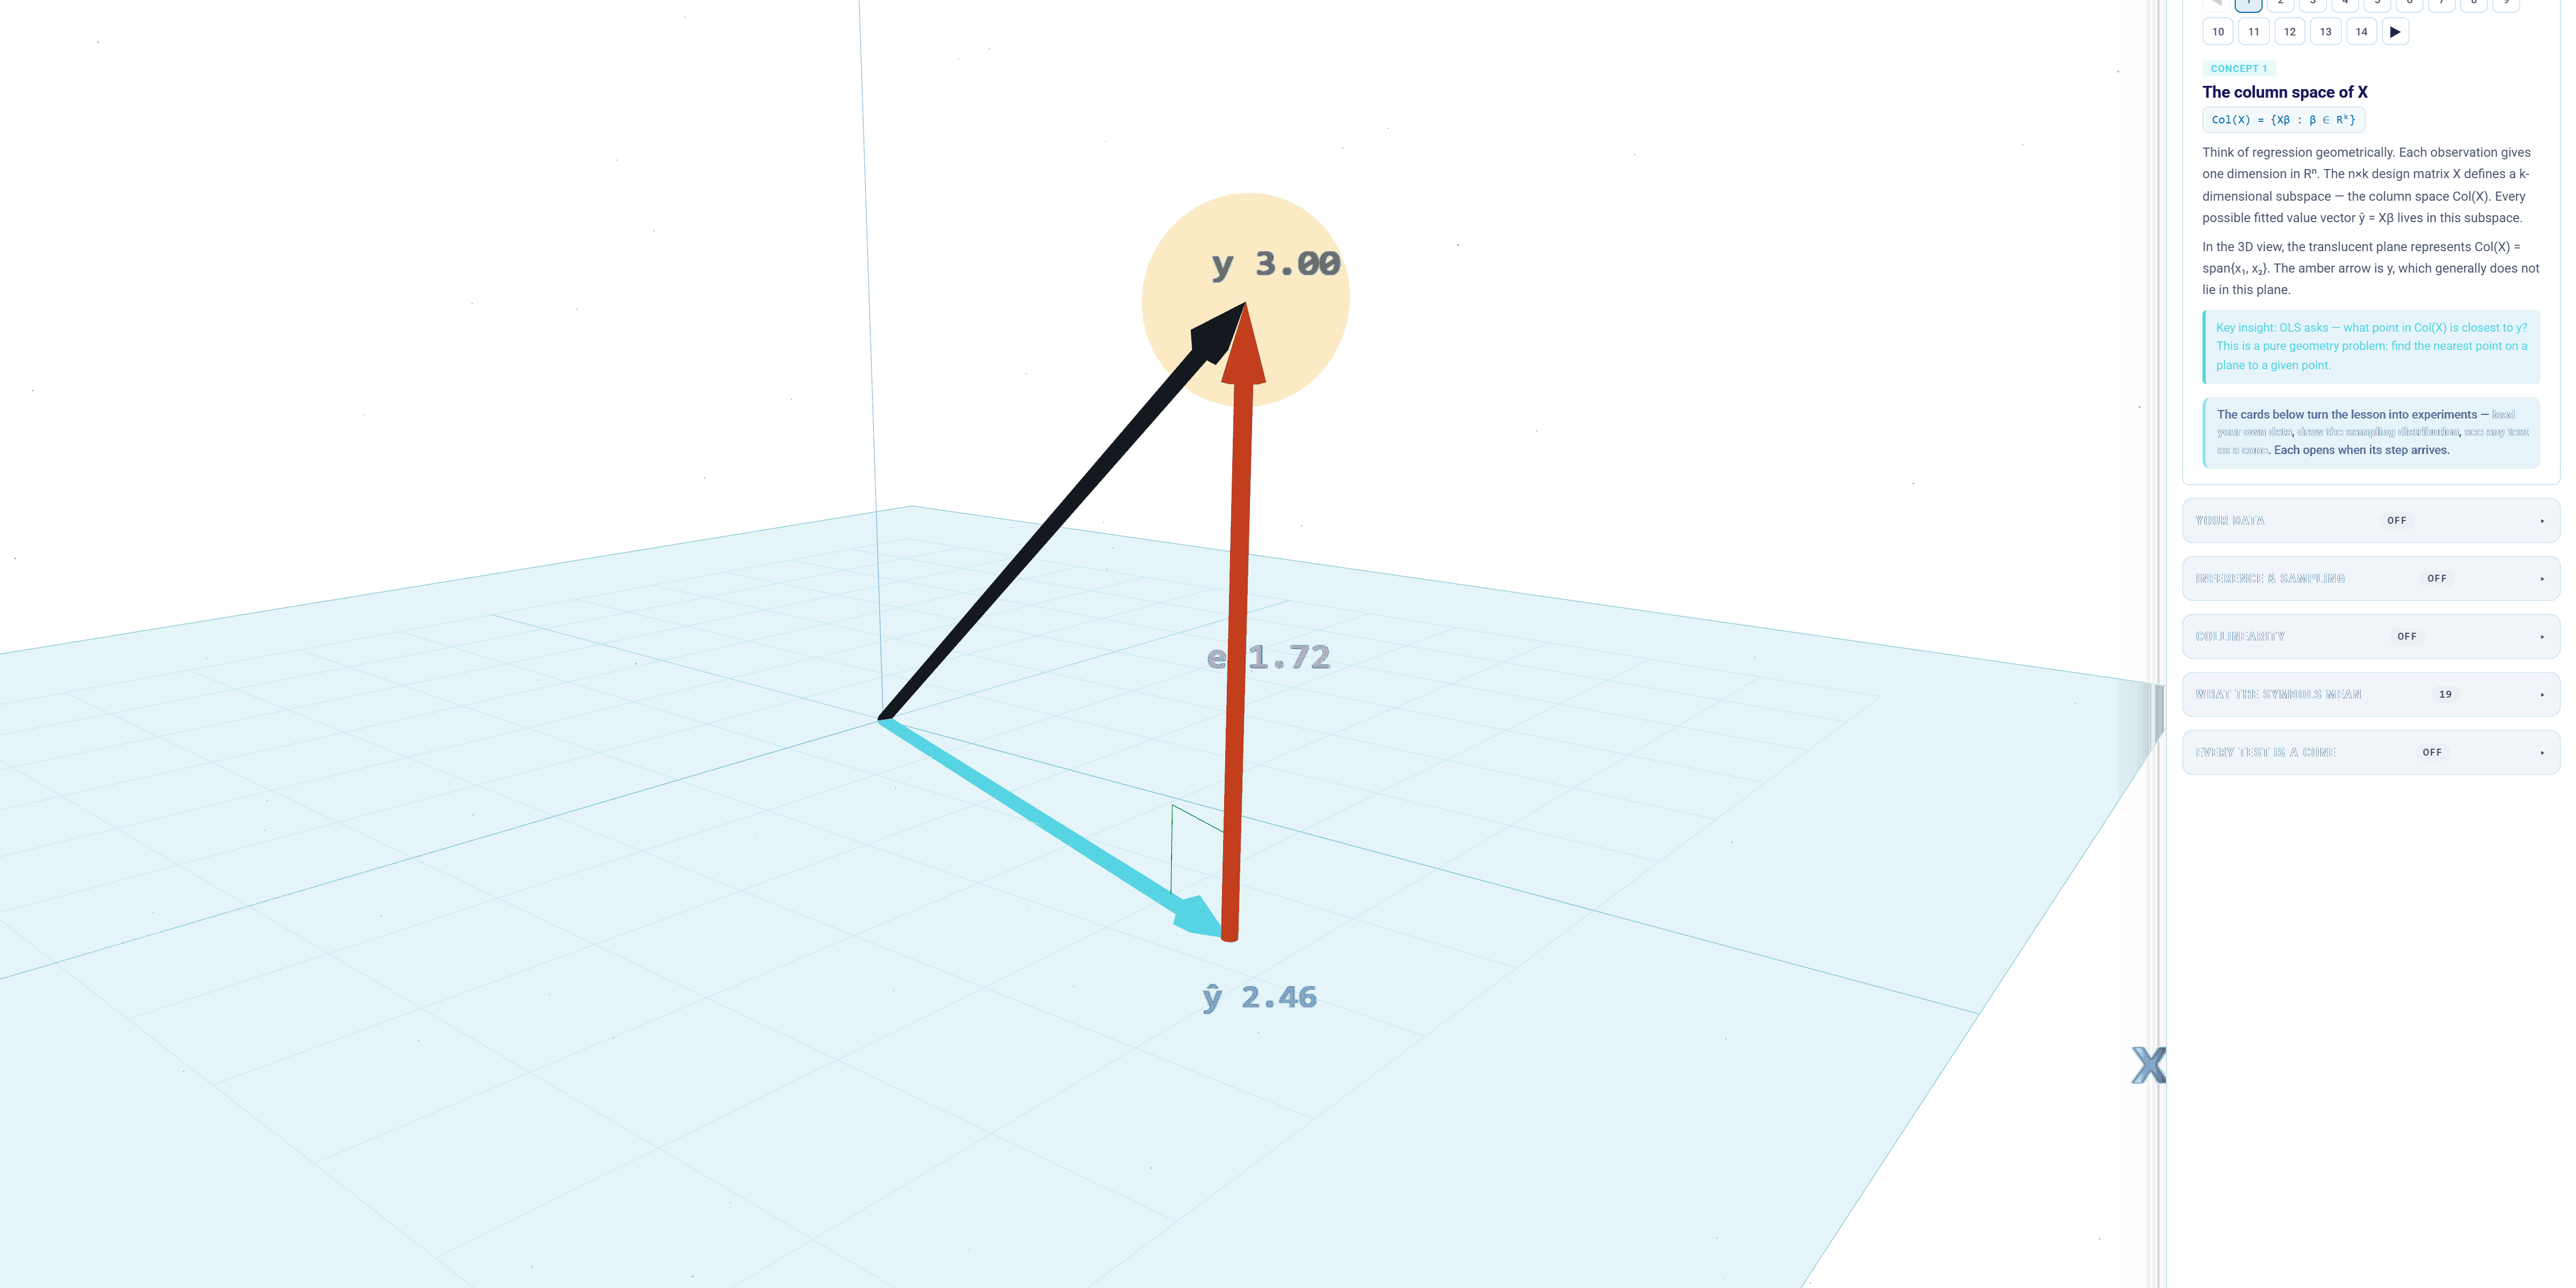
Projection and residualMeeting at a right angle, the whole of least squares in one picture.
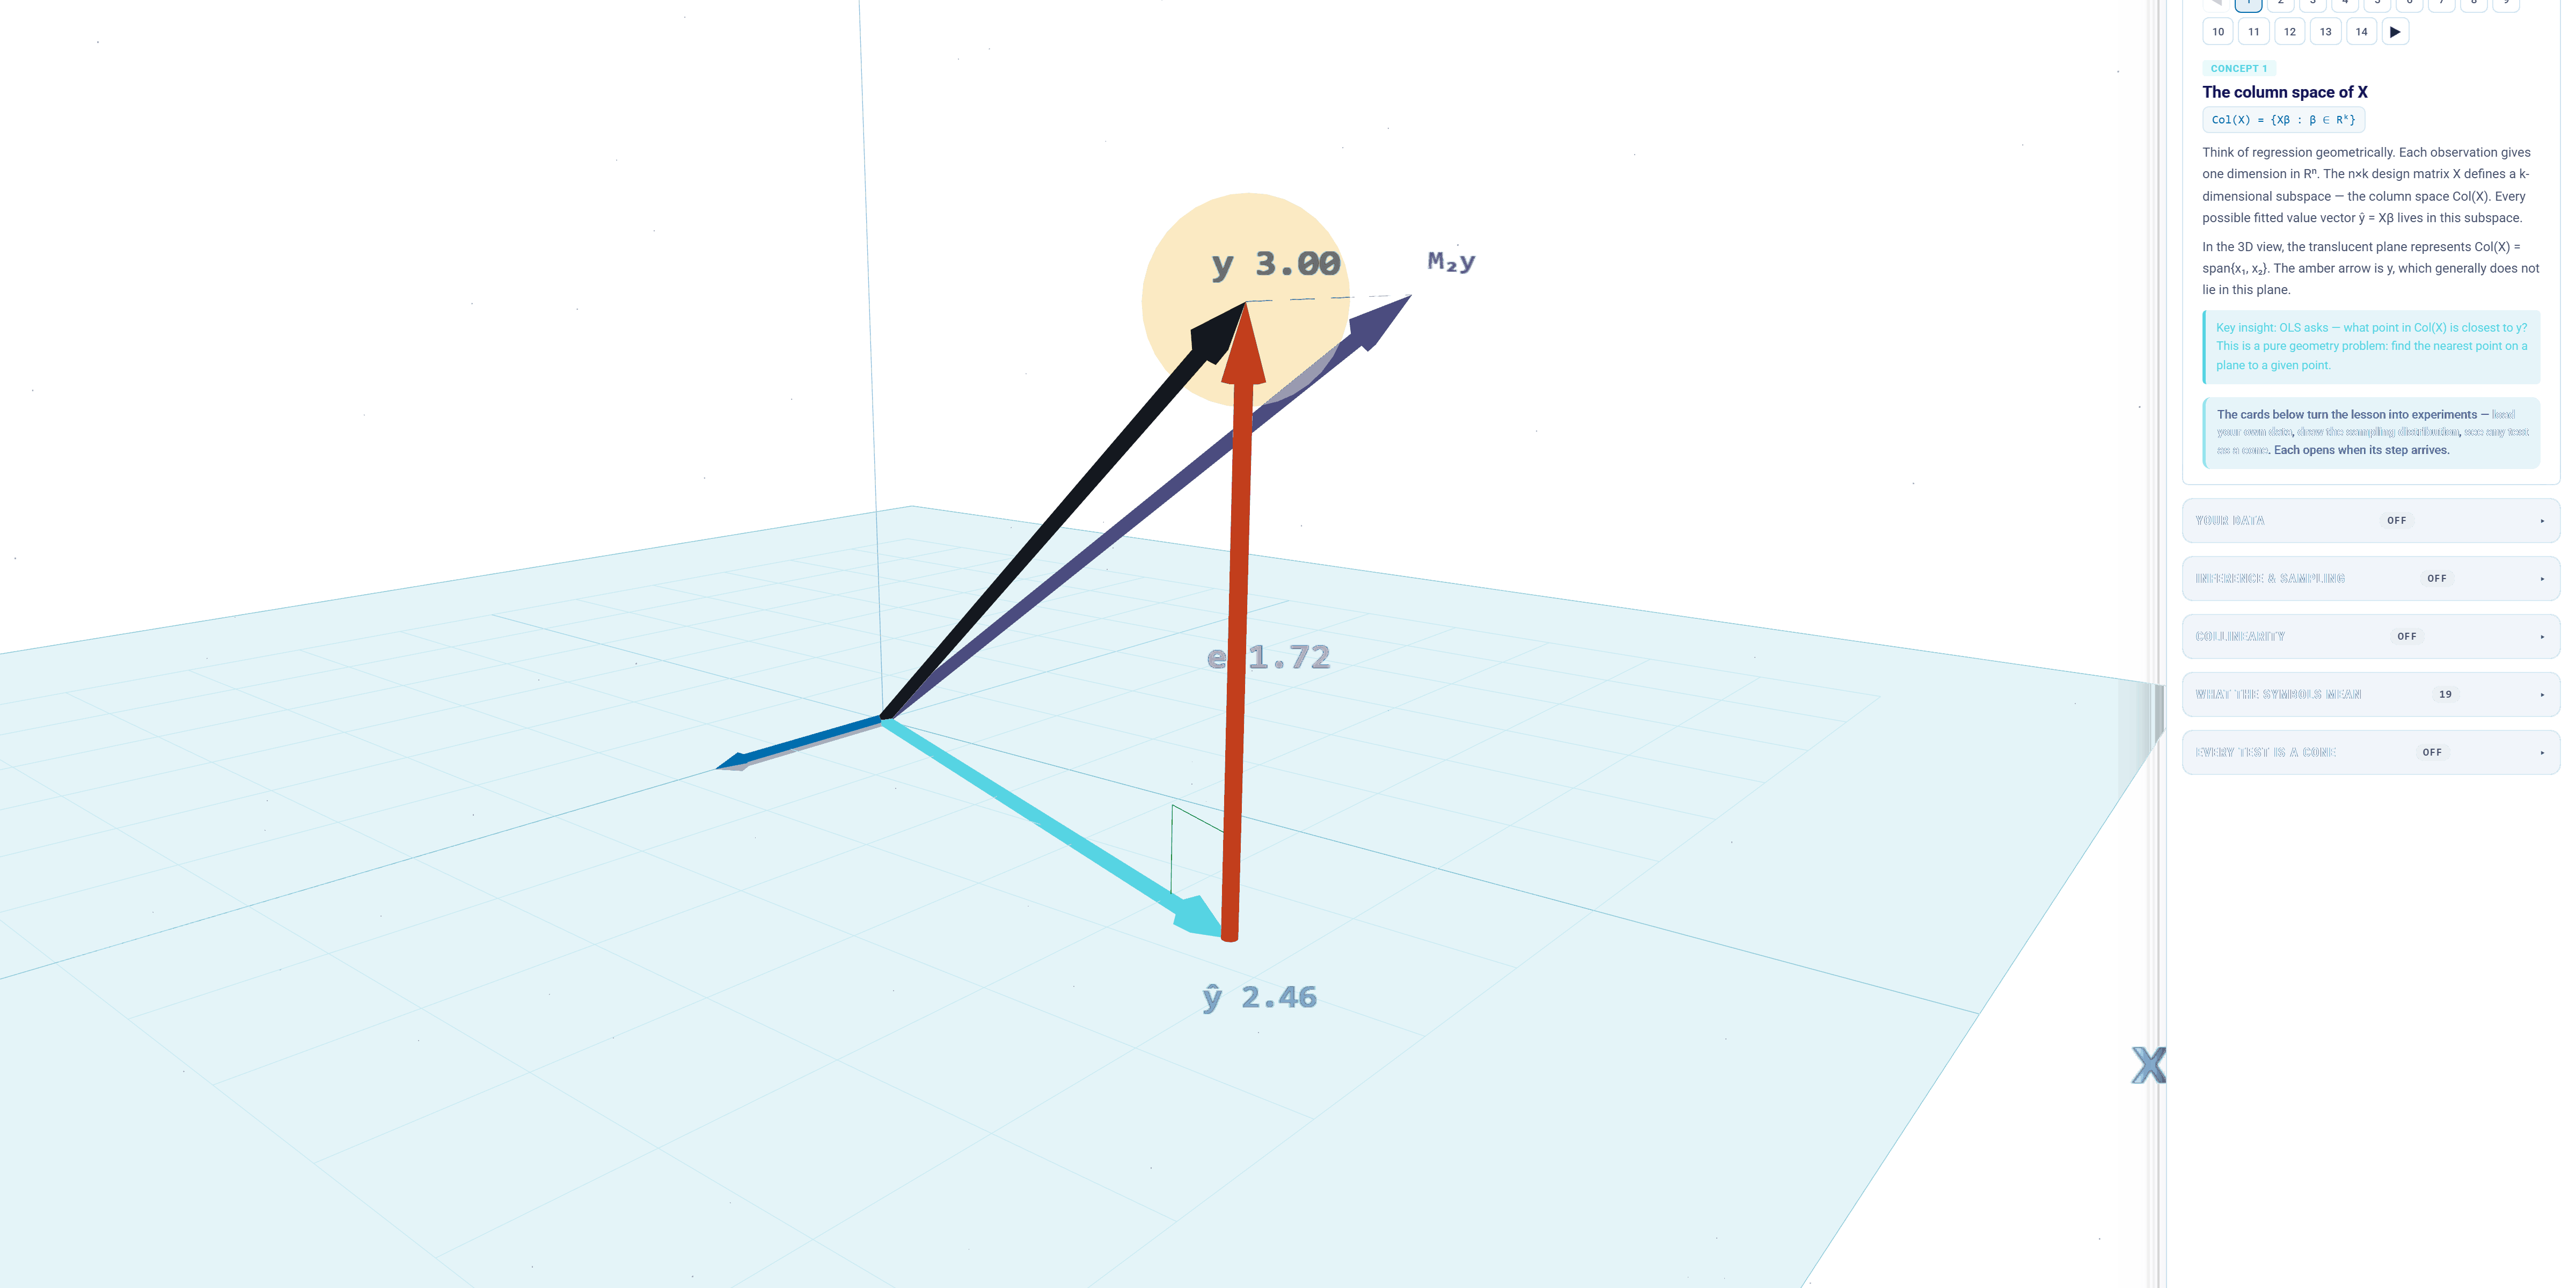
Frisch–Waugh–LovellThe partial, drawn rather than derived.
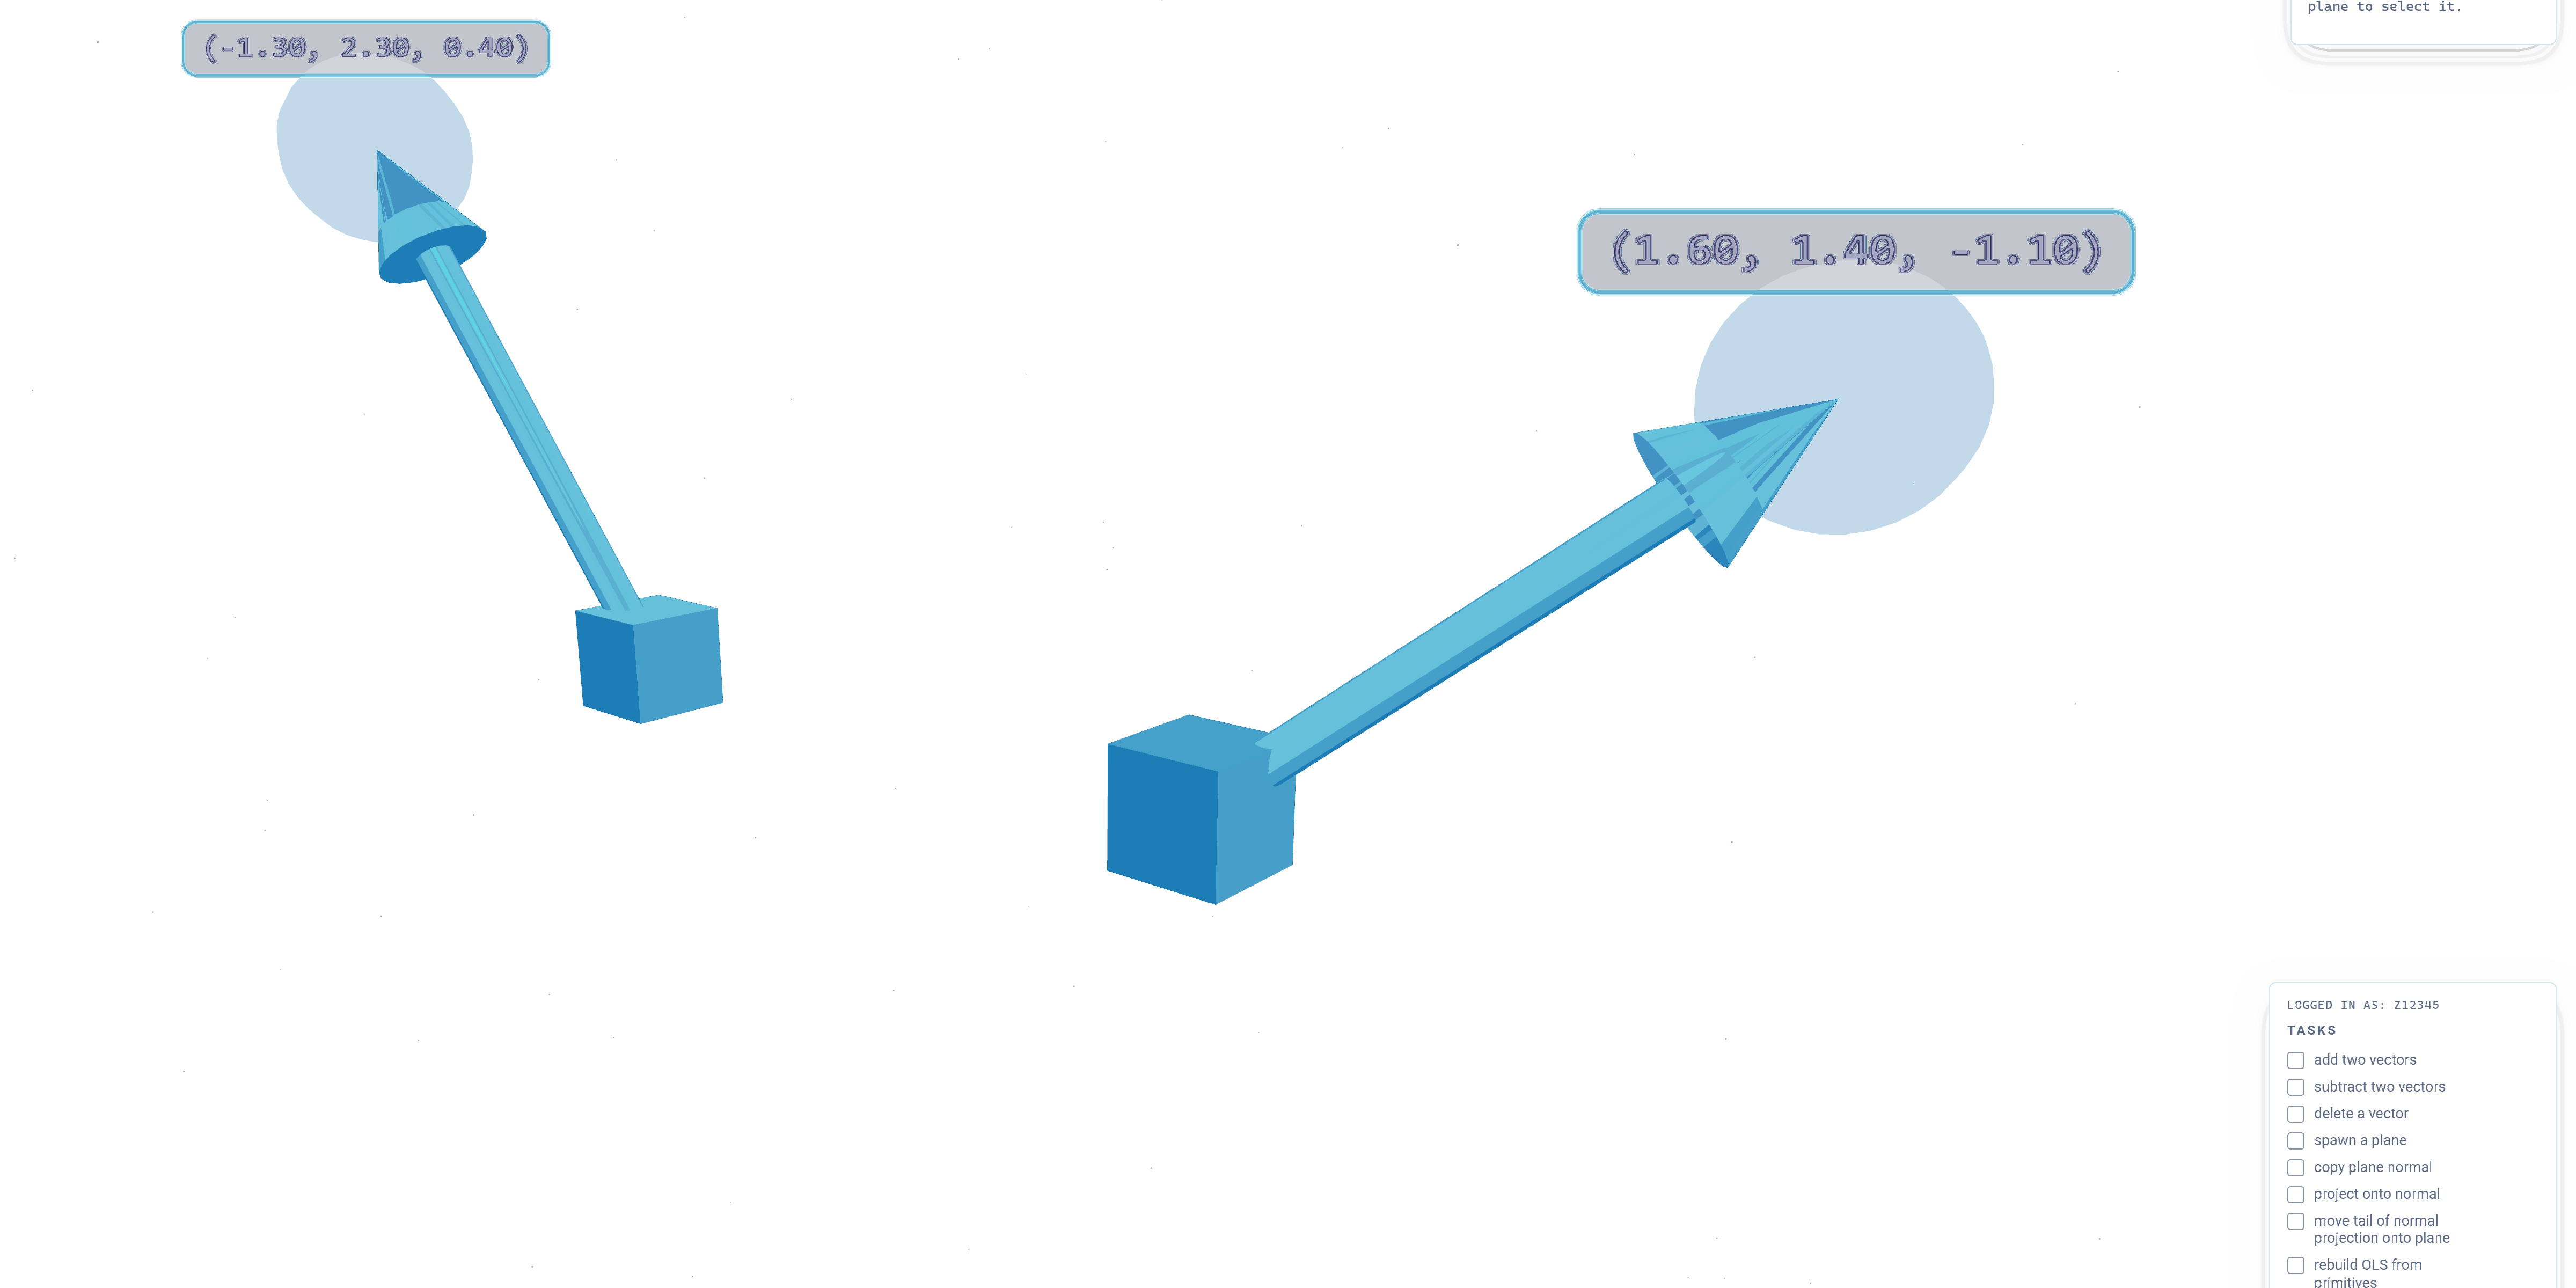
The SandboxWhere the construction is built from nothing.
The module. Students handle three-dimensional representations of vectors, projections and residuals in regression models. It draws on constructivist and embodied learning theories and complements the lecture rather than replacing it.
The geometry it draws. The column space of X is what the predictors span — a line for one predictor, a plane for two, a hyperplane beyond. OLS projects y onto that space and chooses the plane that minimises the squared length of the residual, which leaves the space at a right angle.
Three builds of one construction. The pilot ran in a headset. The same construction now runs in a browser as Vector Studio, on any machine a student already has, and the VR and AR builds remain available alongside it.
Rated useful, rated harder to use
Average ratings between 3.4 and 3.9 on a five-point scale for “VR improves my understanding of vector algebra” and “VR is useful for learning abstract concepts.”
Rated positively but lower, at a mean near 3.0. Learning the controls is the cost the module still carries.
Mental and physical demand remained moderate on NASA-TLX, suggesting a task that was challenging but manageable.
Increased engagement, deeper conceptual clarity, and enthusiasm for broader application of VR in analytics education.
The sample. Students drawn from four quantitative units in econometrics and analytics. Both instruments are self-report and the findings are preliminary, so they record how the module was received rather than what it taught.
What the figures cover. Perceived usefulness and perceived ease of use, two of the three constructs the Technology Acceptance Model carries. Behavioural intention to use is on the instrument and is not among the figures reported here.
Where the two ratings part. Usefulness runs between 3.4 and 3.9 while ease of use sits near 3.0, four to nine tenths of a point below it. The browser rebuild removes the headset and the installation, which is the part of the module that gap is attached to.
What was measured
Technology Acceptance Model. Perceived usefulness, perceived ease of use and behavioural intention to use — eleven items measuring whether students find the technology useful, find it easy, and intend to keep using it.
NASA Task Load Index. Six subscales of cognitive load: mental demand, physical demand, temporal demand, performance, effort and frustration.
Prior work
Links

demonstration

explained
Adjunct Research Fellow · Monash University European Research Foundation (MUERF), Prato, Italy
Corresponding authors · nazirul.hazim@monash.edu · shalini.nagaratnam@monash.edu